
Compare revenue and booking performance
Review revenue, bookings, events and lead conversion. Compare reporting periods to see where the numbers have changed.
Track revenue, bookings and lead conversion across your business. Review income alongside crew pay, travel and material costs inside an event to understand what the job earned.
Reports
Compare revenue, bookings and conversion with an earlier period, and switch any chart to a table to read the figures.
Explore reports & finances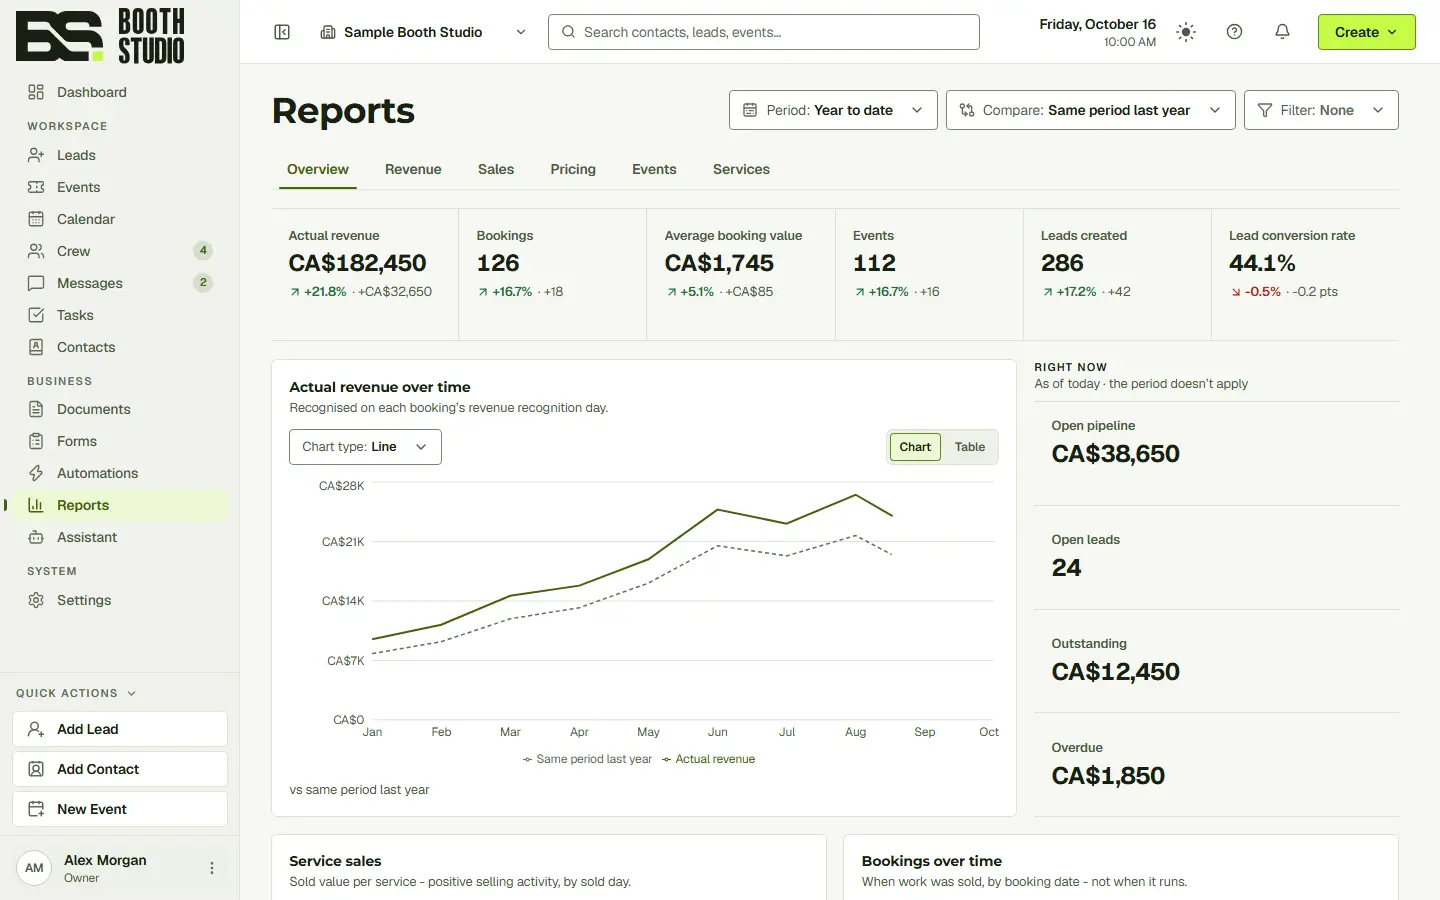
Playing Automations in 6s
Every booking adds up here.
Reports show how revenue and bookings change over time. Event financials let you review the expenses behind a particular job, including crew pay and consumables such as ink and paper.
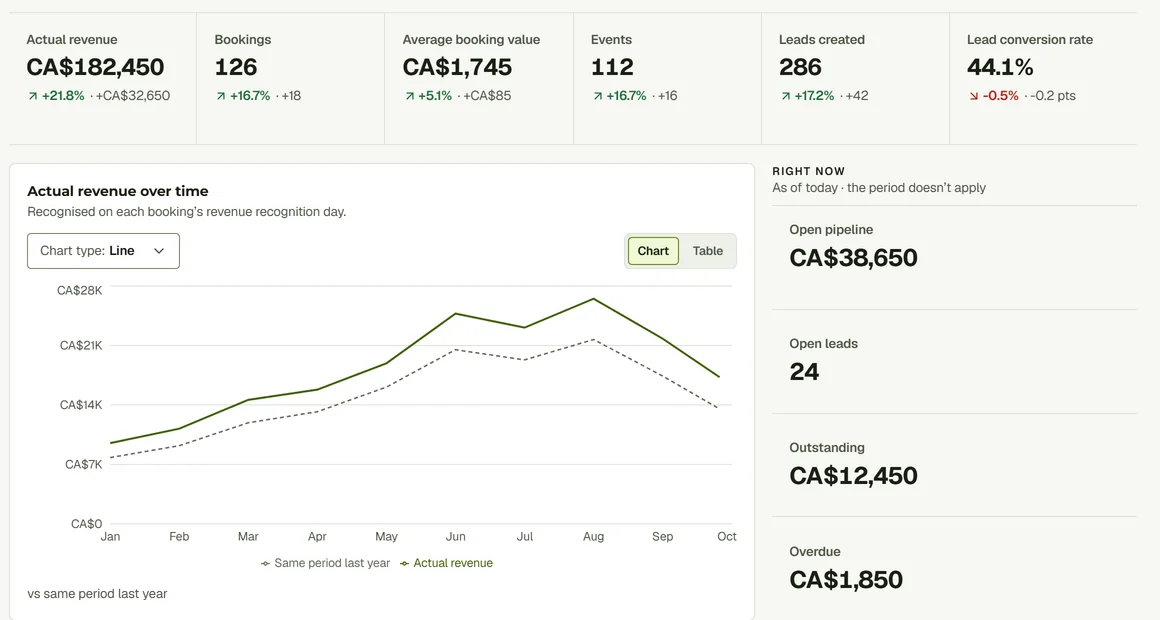
Review revenue, bookings, events and lead conversion. Compare reporting periods to see where the numbers have changed.
Explore the chart, highlight a point or switch to a table when you want the individual values behind the trend.
Record crew and material costs in the event’s Financials tab. Review them alongside income rather than judging the booking by its total alone.
Try the controls on this sample revenue report. All figures are fictional.
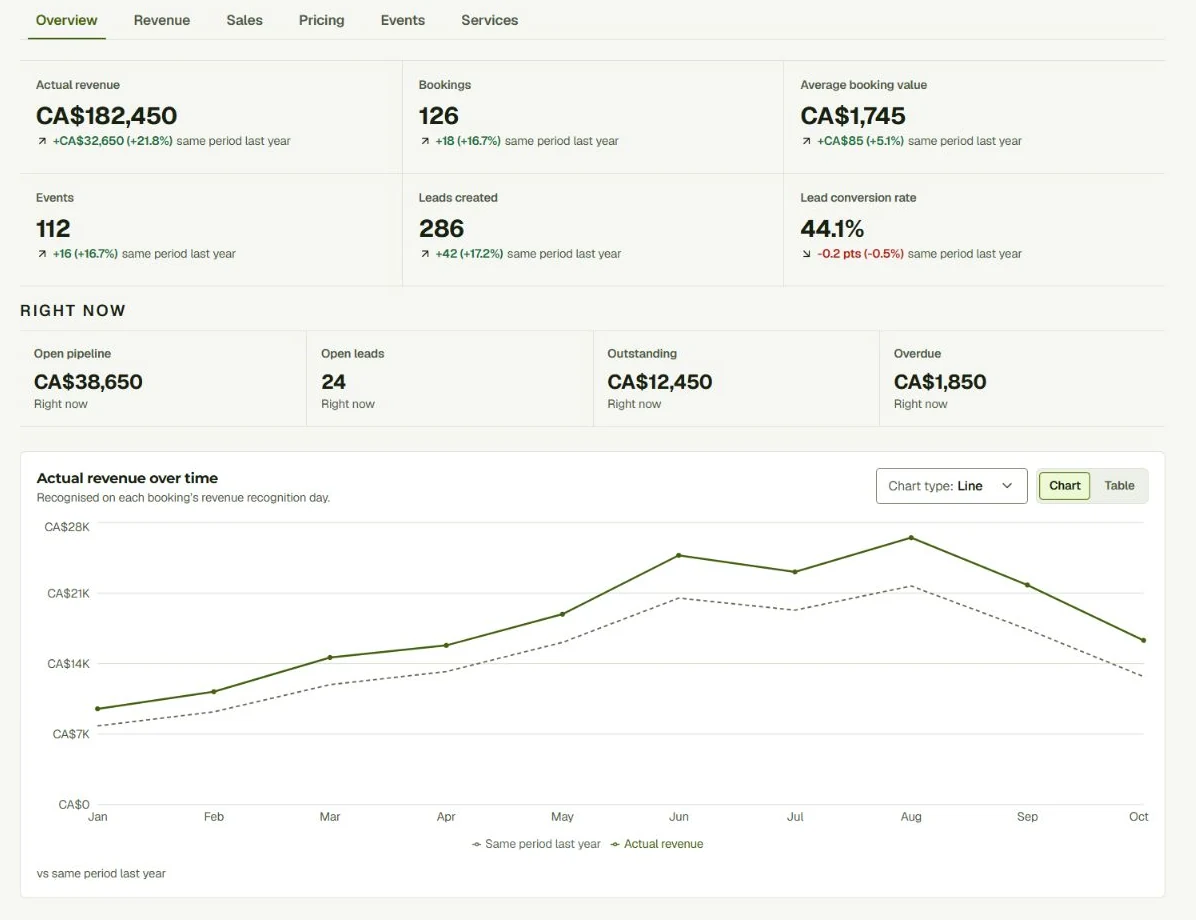
Yes. The report controls let you move between a visual trend and its values.
Yes. Record crew and other expenses in the event’s financial view.
Not yet: QuickBooks Online sync is on the roadmap. Meanwhile, Reports show revenue, bookings and what each event cost.
Start with the full CRM. Choose the seats, storage and communication allowances your team needs.